🔍 Discover McLloyd Spectator, the first web-based data-visualisation platform for horse racing, adopted by France Galop and Hollywoodbets, and acclaimed by professionals across the industry.
Relive the Prix Rothschild in data mode here : vidéo Prix Rothschild 📹
Click here and try it now — free and with no commitment
Home Page
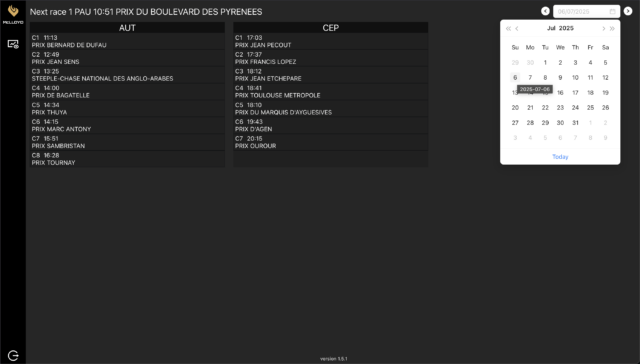
Quickly access the data replay of more than 16,000 France Galop races (with historical data available back to March 2021), or simply watch the races live through our Aerial View:
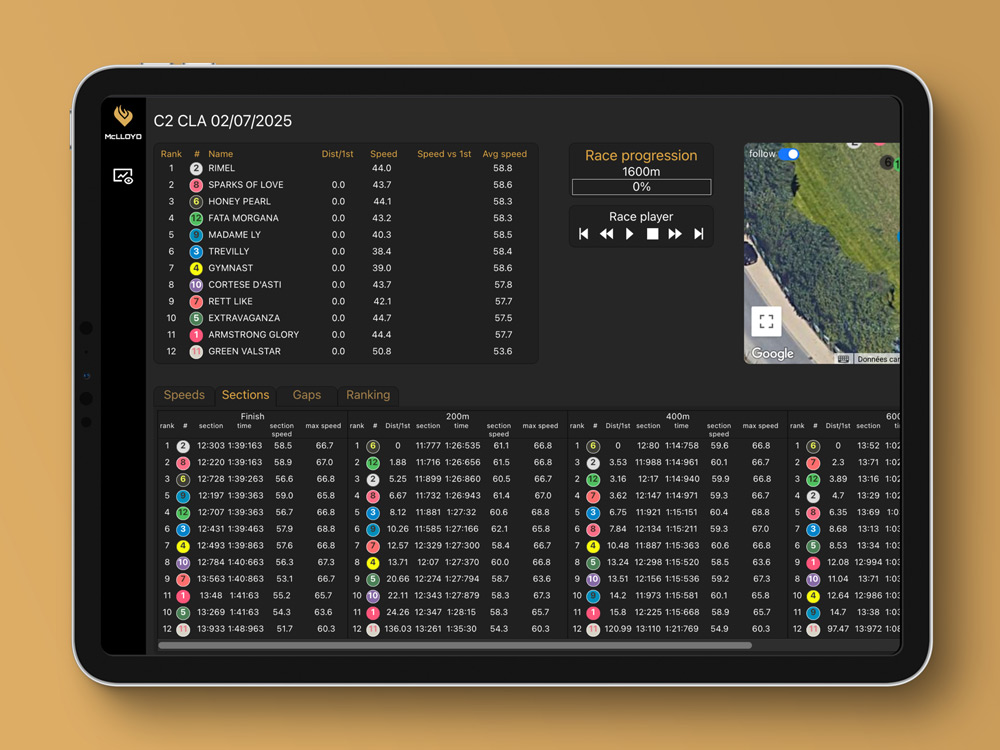
Main Dashboard
View every race — live or in replay, with precise 10 Hz tracking that lets you compare instantaneous speeds and trajectories.
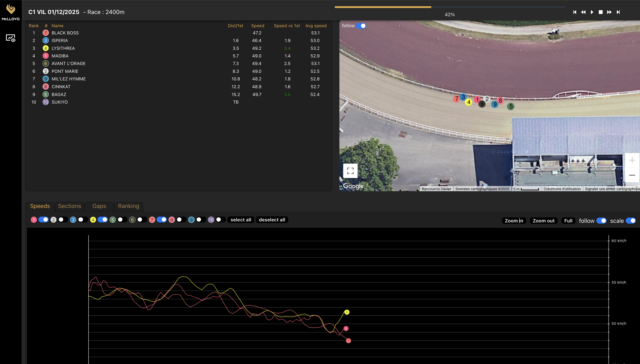
Measure the gaps
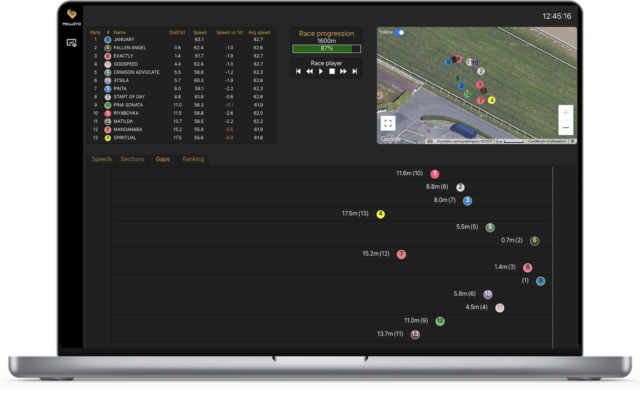
Thanks to our 10 Hz data transmission and GPS accuracy, you know the exact instantaneous gap between all horses at any key point of the race!
Sectional Timing
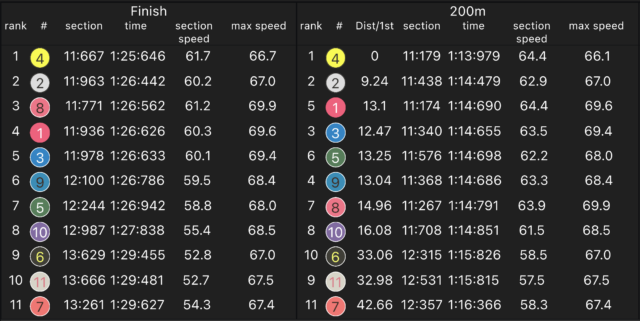
View times, speeds, and gaps at the front every 200 m in a dynamic table
Visualise your races in data mode now
🎁 Enjoy your free trial (1, 2 or 7 days depending on the plan) to discover how to:
Anticipate horse performance in real time
Compare trajectories, speeds and positions like never before
Optimise your analysis thanks to ultra-precise data that supports decision-making
Want to go further?
We offer personalised demonstrations to show you how to leverage live data on your races.
Ask us your questions — our team replies within 24 hours
Receive advice tailored to your activity (trainer, jockey, analyst, etc.)
👉 Book your free demo ici
👉 Or write to us directly ici
Customers Testimonial :